Cisco Sensor Test JTBD Workflow + Analytical Dashboard
Provide actionable troubleshooting insights by smart sensor
My Role: – Evaluate the stuck design, which was left by the previous designer, by running usability testing with researcher – Redesign JTBD workflow for set up sensor tests, and introduce the new JTBD methodology to feature team – Design a analytical dashboard to interpret the real-time, massive data captured by sensors
Contribution: The new user experience contributes to earning 1K+ early adopters for Cisco. I was fortunate to be nominated for the Cisco EN Innovation All-Star.
Teammates:
1 x Designer (Me)
2 x Product Manager
2 x Tech lead + Tech Marking Engineer (Industry expert)
10+ x Engineers (Wireless + Wired + Device engineer team)
Understand Context
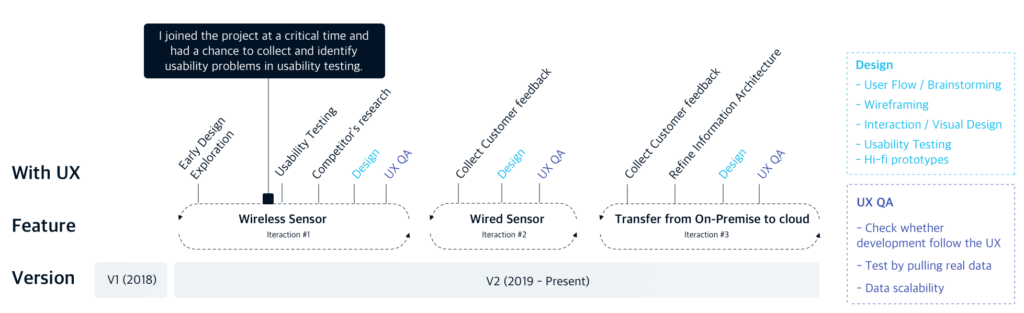
I took over this project from another product designer. When I joined the project, the design was stuck and progress already fell behind schedule. Although it is my firstproject in the company without any domain knowledge, I meet the schedule and help the feature launch successfully.
Problem Context
For today’s enterprise network team, there are three main pain points:
Hard to scale: It requires large teams of dedicated network engineers to keep the network up and running because of thousands of APs and devices.
Lost productivity: When an issue has been finally reported to the end-user, regardless of how fast the team can resolve it, the damage has been caused.
Hard for Global maintenance: Large international enterprise that has employees in buildings around the globe. They need to maintain a complex multi-regional network to keep each of their offices connected to the data they want to access.
Product Goal
We aimed to provide network performance monitoring and anomaly detection capabilities by utilizing Cisco sensors. Let a single network engineer can manage a network more efficiently than what was ever possible with an entire team.
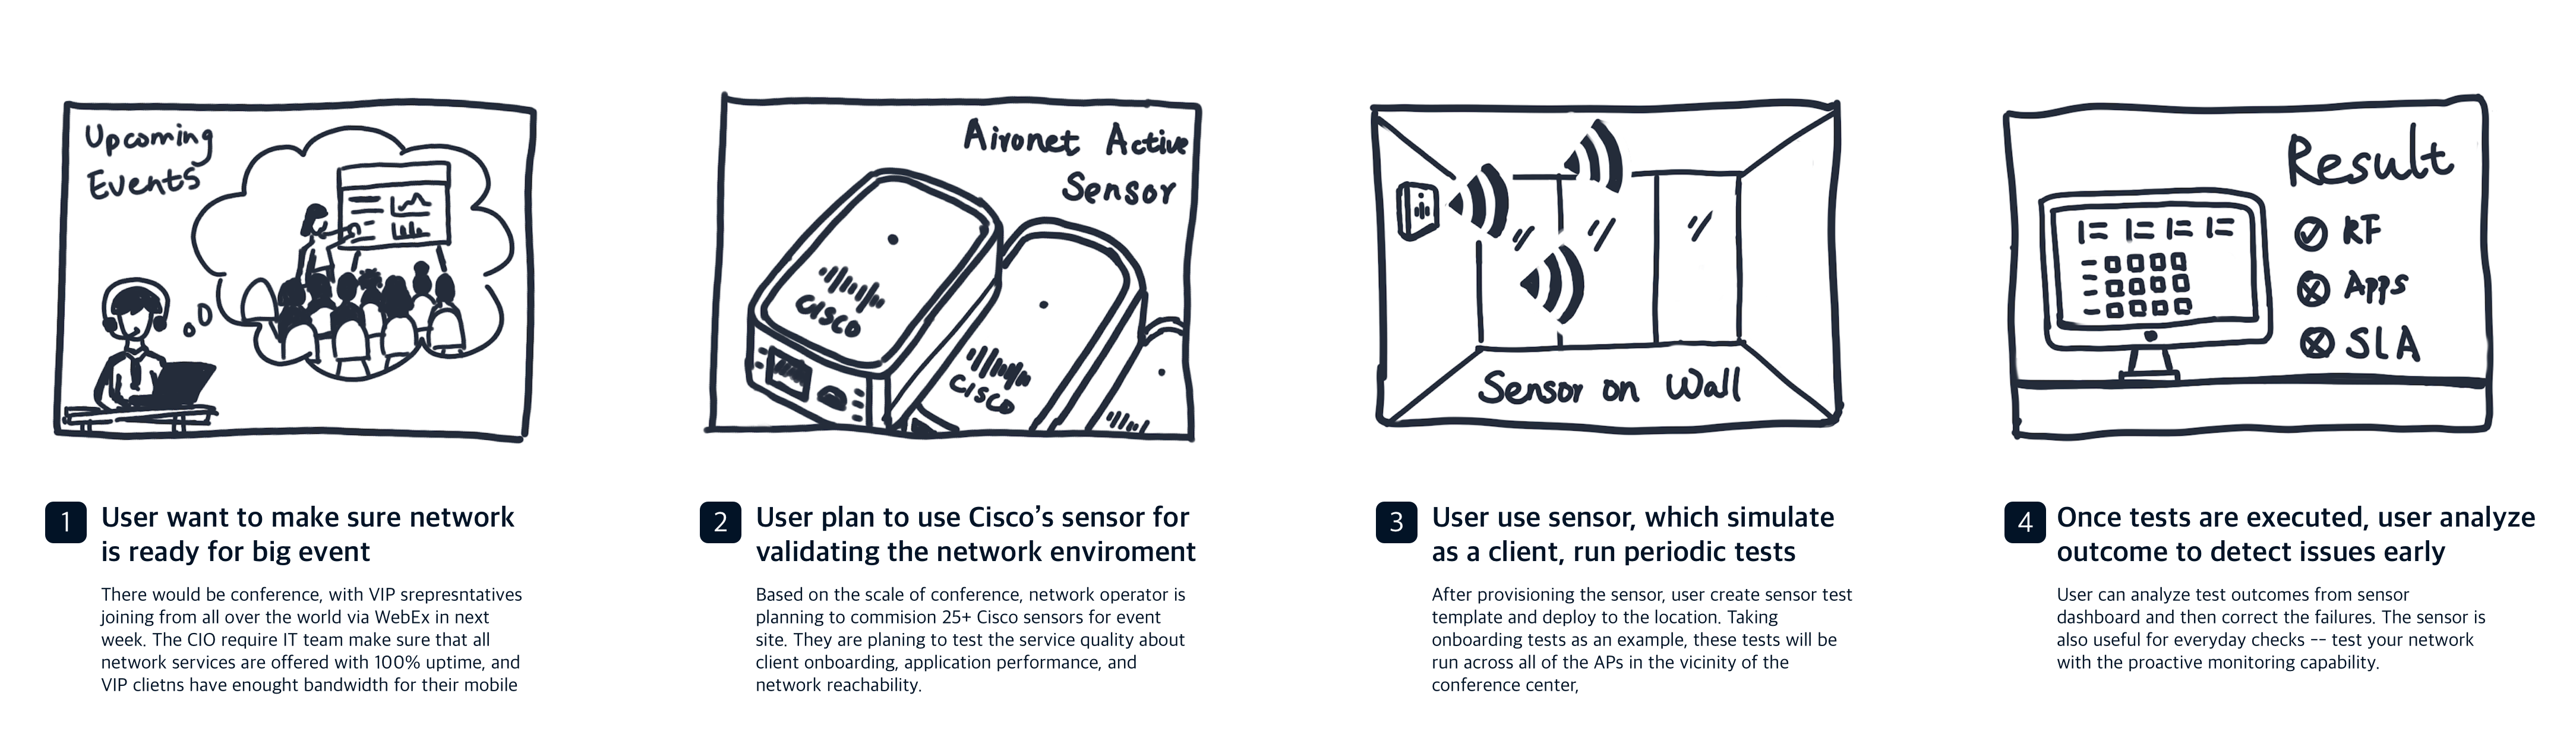
Using a dedicated sensor to serve as AP to simulate real-world client performance
Run periodic sensor tests to ensure good network performance
Monitor Real-Time Endpoints/Devices
Troubleshooting and proactive health assessment
Scenario
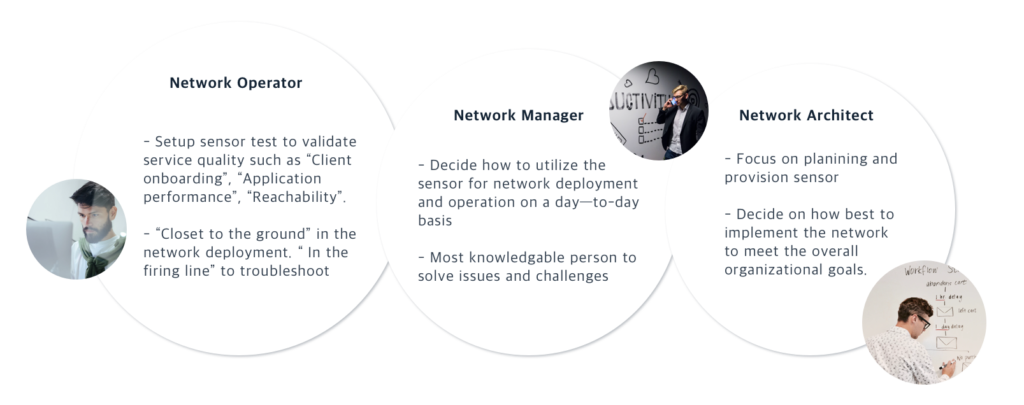
Three Types of Users
Learning & Questioning
“Without the holistic view of the system, I hardly design mechanism with a good user conceptual. This situation urged me to ask for domain lessons from the Technical Marketing experts, engineers, and PM. “
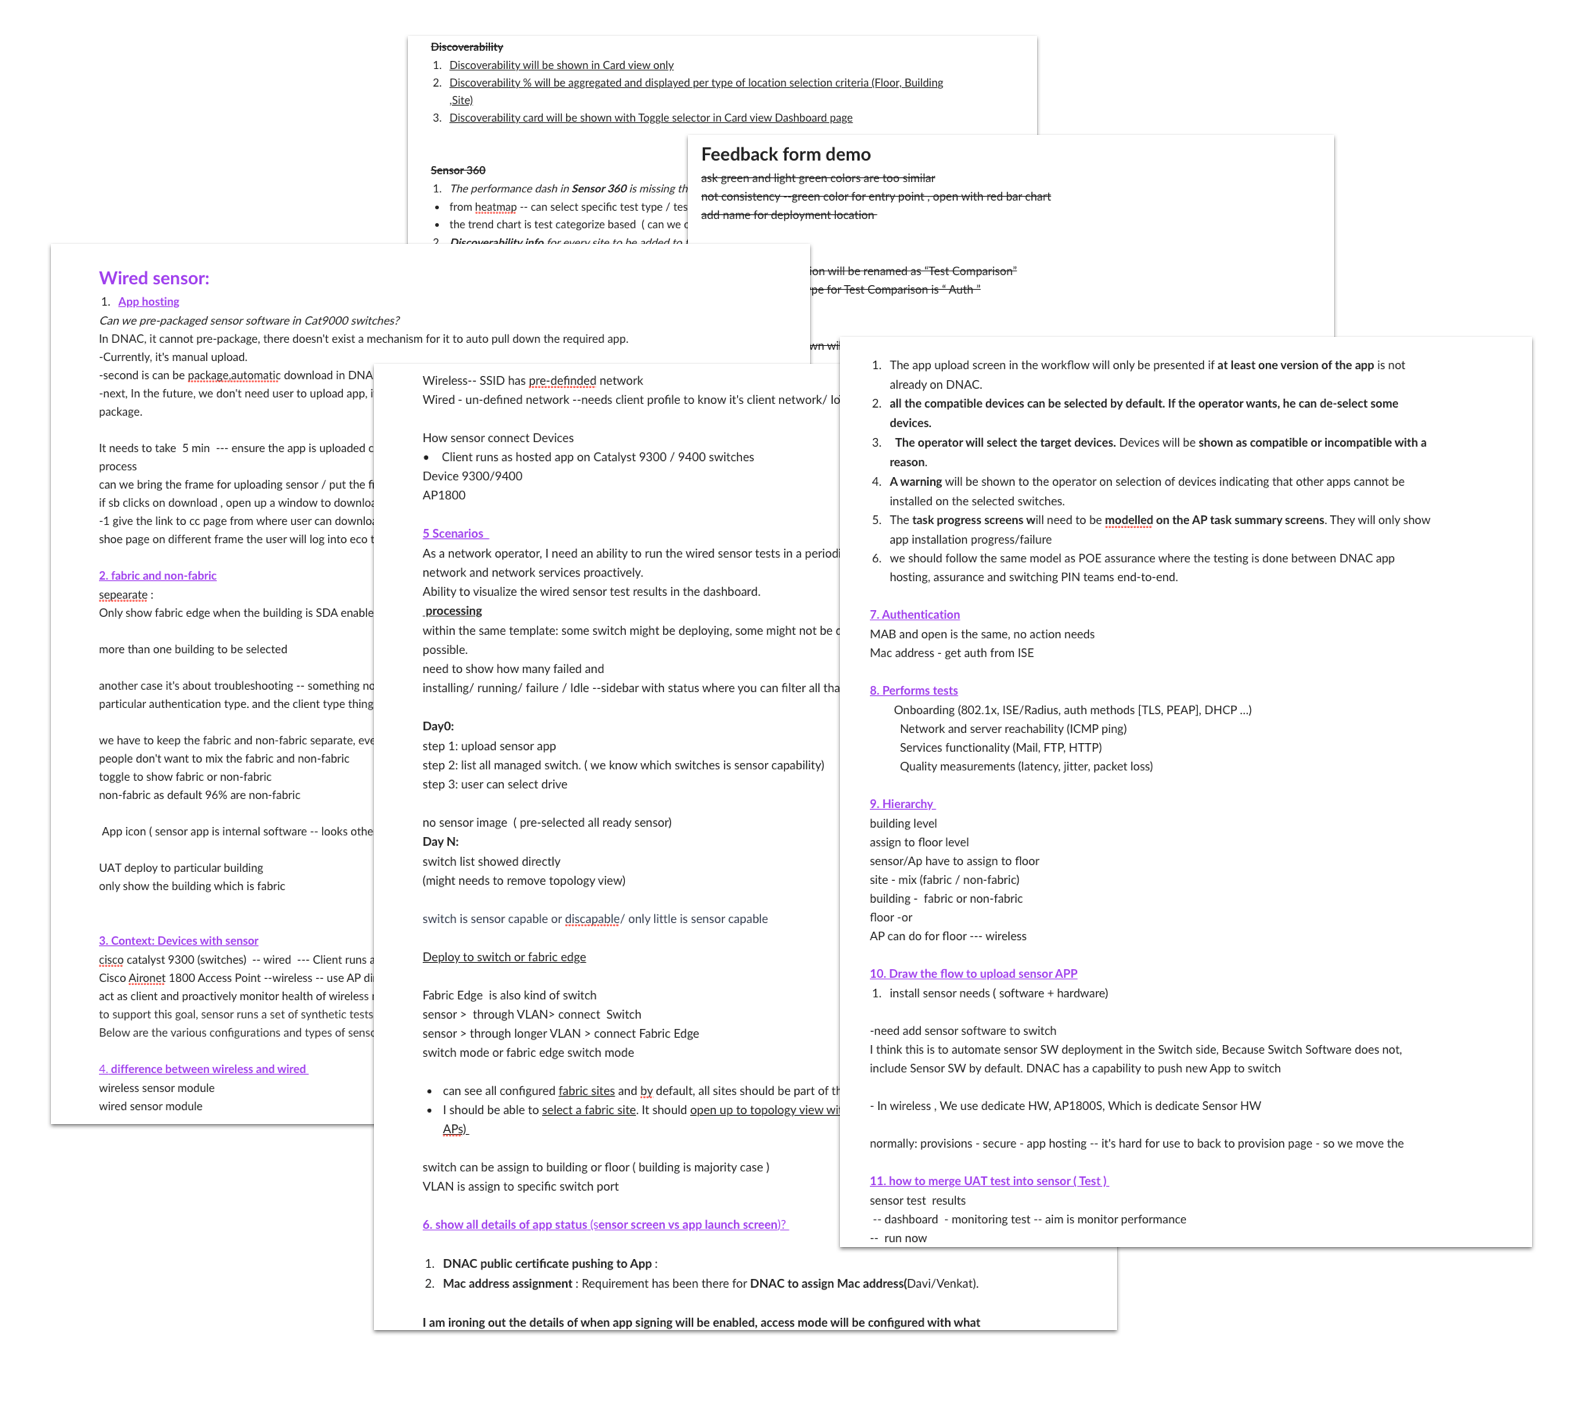
Documents
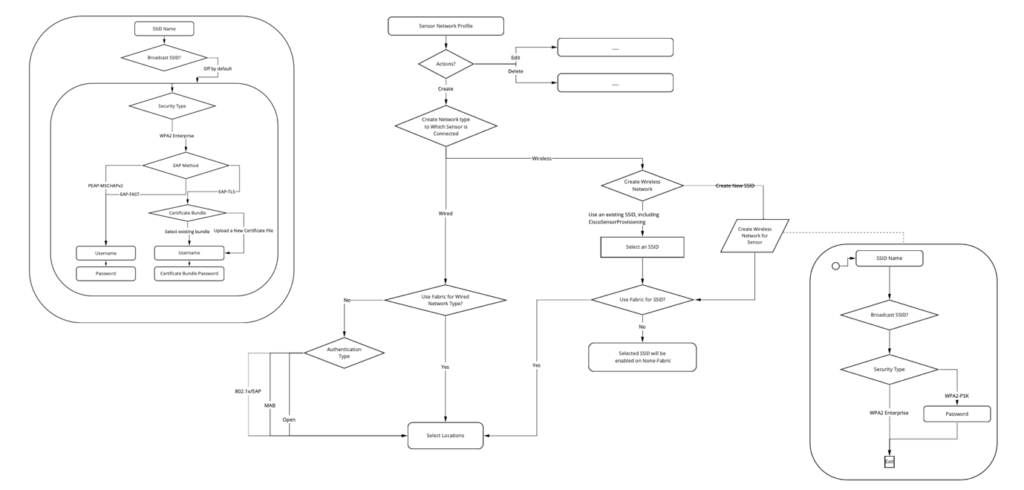
Logic Flow
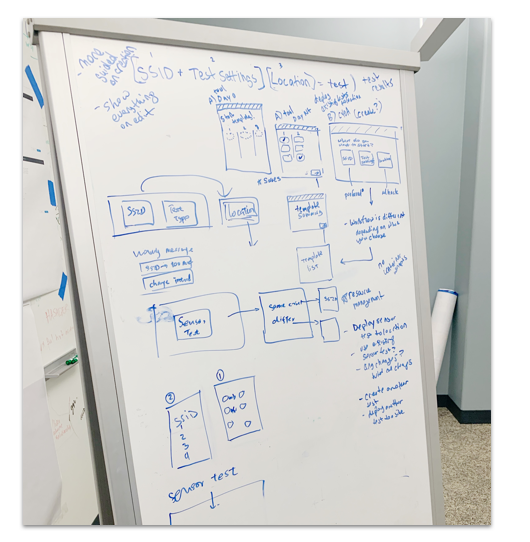
Whiteboard
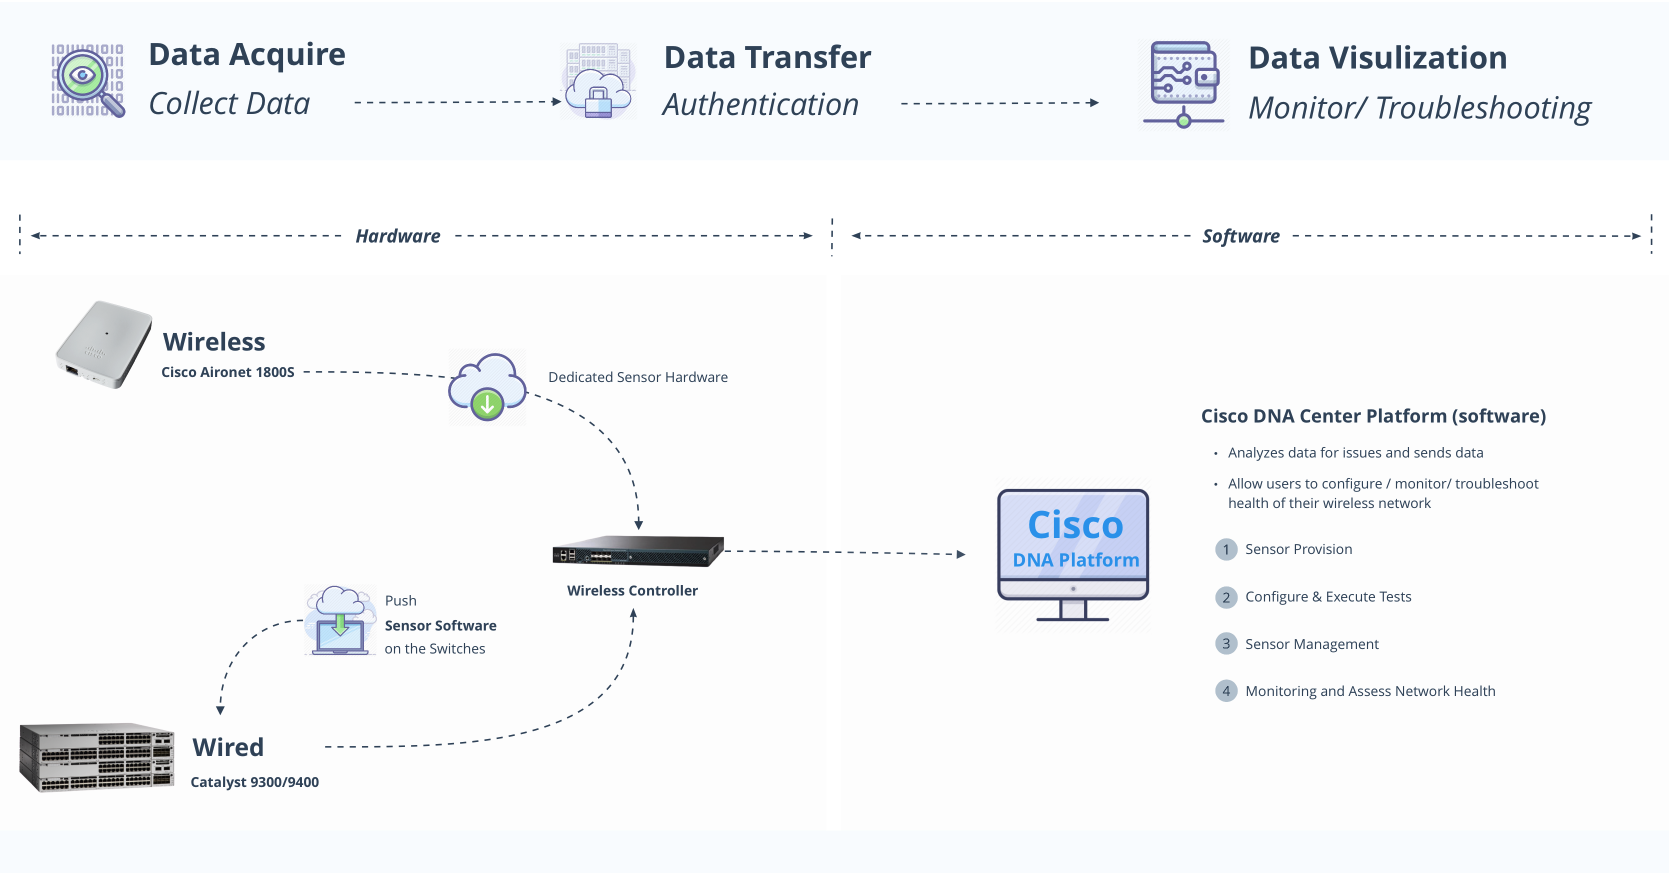
Overview Flow
I drew the overview flow based on my understanding of the ecosystem. This end-to-end view shows how users go from initially mounting the physical sensors in the office to running the wireless test on Cisco DNAC. It helps me to create an intuitive, cohesive and seamless user experience across all phases.
Hardware
Wireless: Aironet 1800S sensor
Wired: Catalyst 9300/9400 switch
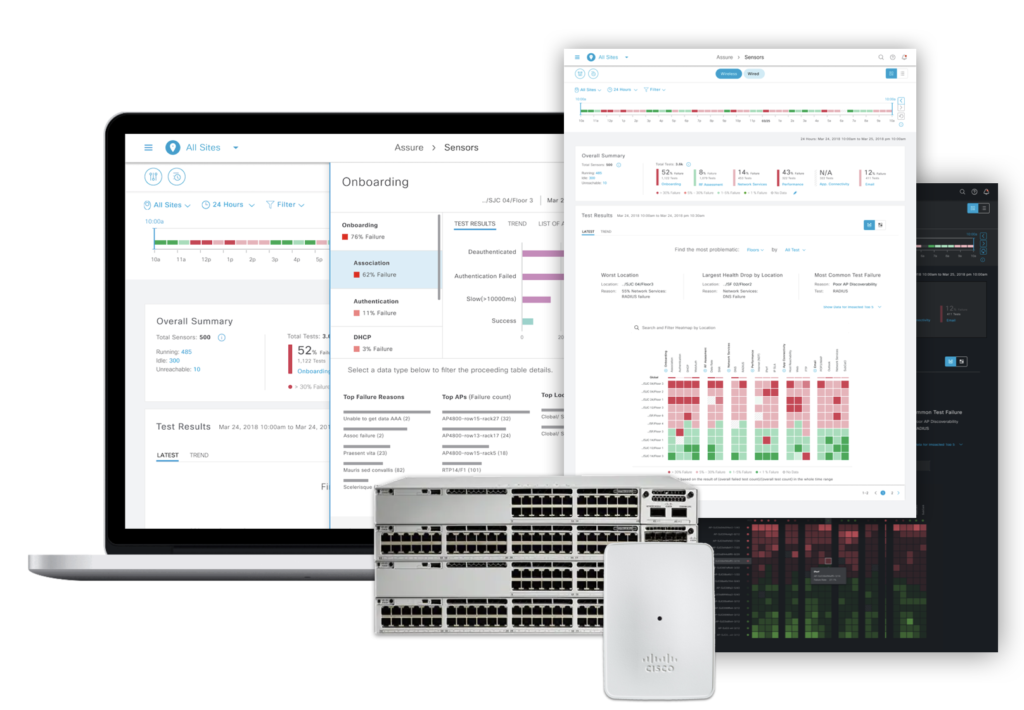
Software
DNA Platform – Allows Users to configure, monitor, troubleshoot the health of their network performance
“Armed with that context and insight, I was able to structure the large-set data into several hierarchies with logical order that users were familiar with, which allowed users to dig into the root causes layer by layer.”
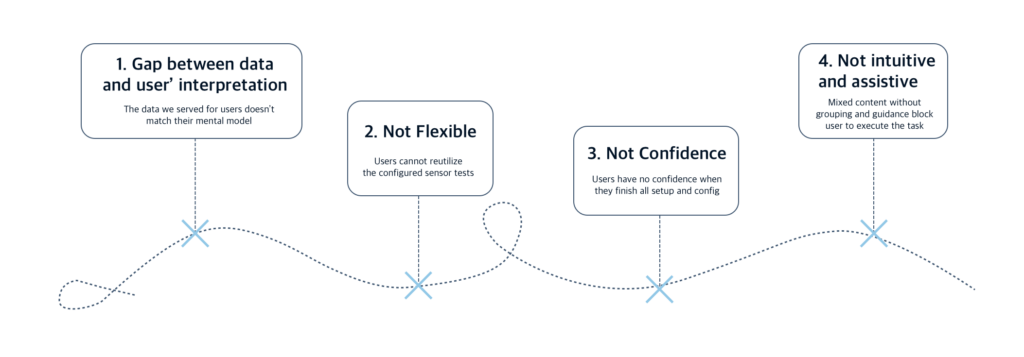
Identify pain points
1. Gap Between data and user’s expectation and interpretation
Before – Problems
As for the scheduling step, I found that users’ expectations and interpretation didn’t match mechanism we provided. Users are hard to make choices between multiple options (Such as “test interval” and “run now”. )
Both our existing and potential users had difficulties align the test template with the result on the sensor dashboard.
How to solve…
To help users get a better understanding of data. I worked with engineers to understand how the system works behind the screen
Q: How tests were assigned to sensors?
Q: How sensor allocate resources for running tests?
Q: How to calculate the time for tests?
And worked with PM and customer to identify the use cases
Q: How user schedule a test?
Q? What are users’ expectations?
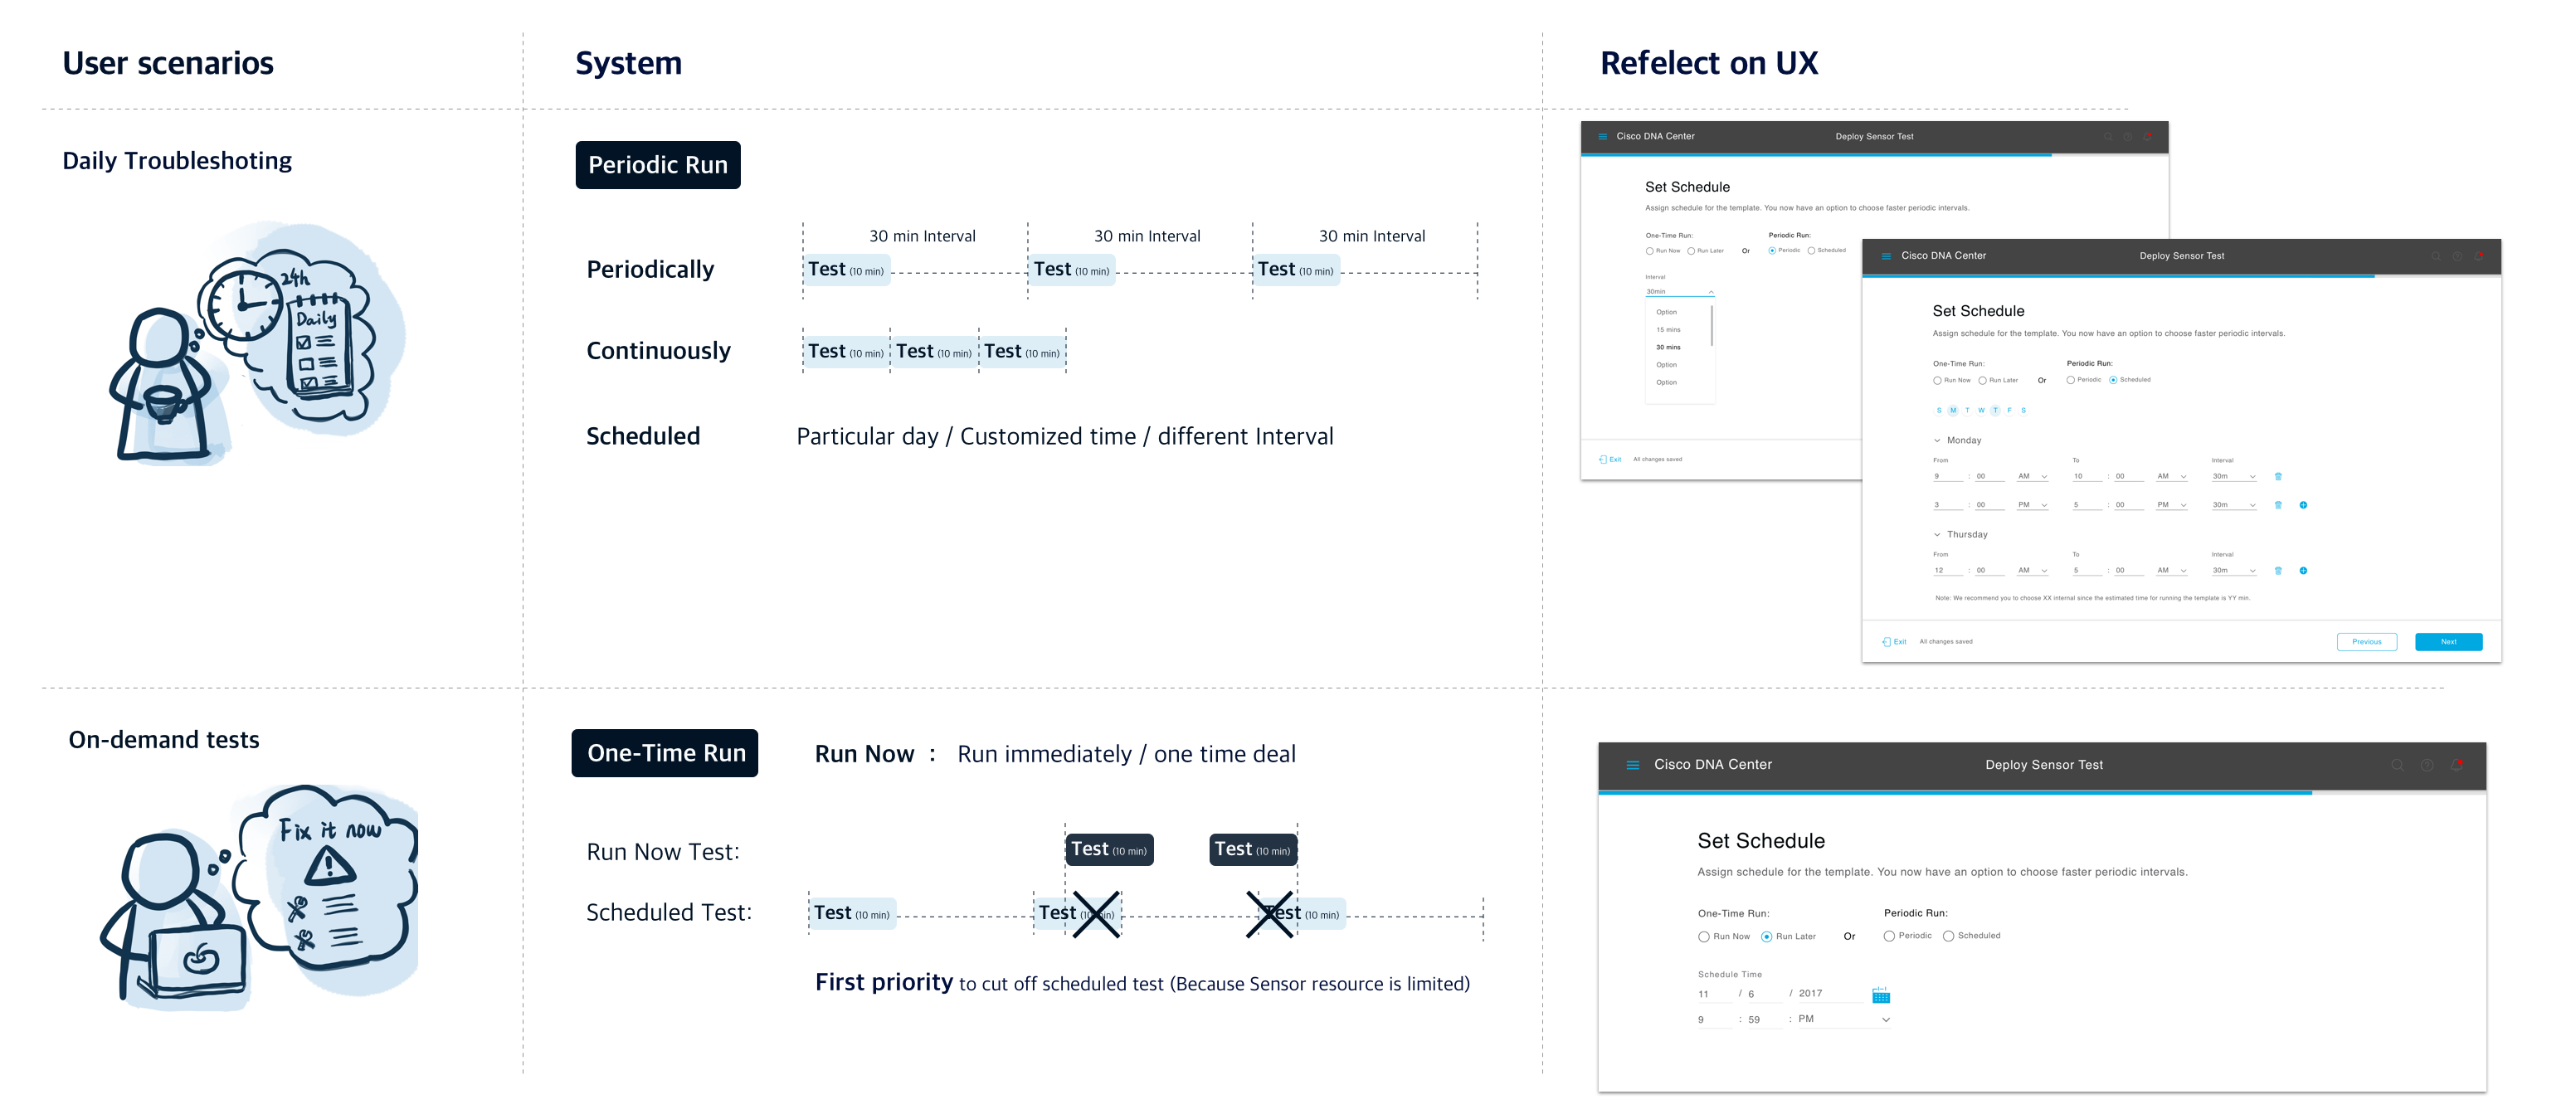
After – Solution
There are two kinds of scenarios for users, butwe mixed two cases. That’s the critical point to cause misunderstanding.
Scenario 1 is run Now option addresses the desire for on-demand tests
Scenarios 2 is recurring tests with interval fit for daily or weekly troubleshooting.
“Reidentify the user scenarios to design the suitable options for the right people”
2. No flexibility because of unpleasant structure
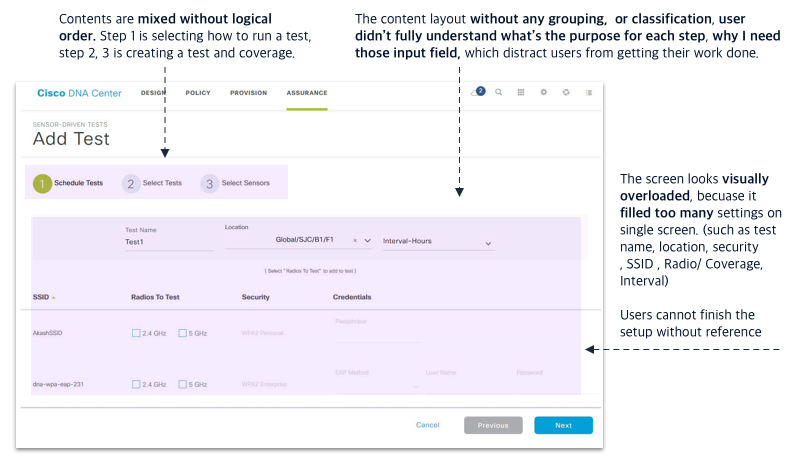
Before – Problems
– Setting up a sensor test took user a lot of effort
– User cannot reutilize the configured sensor test
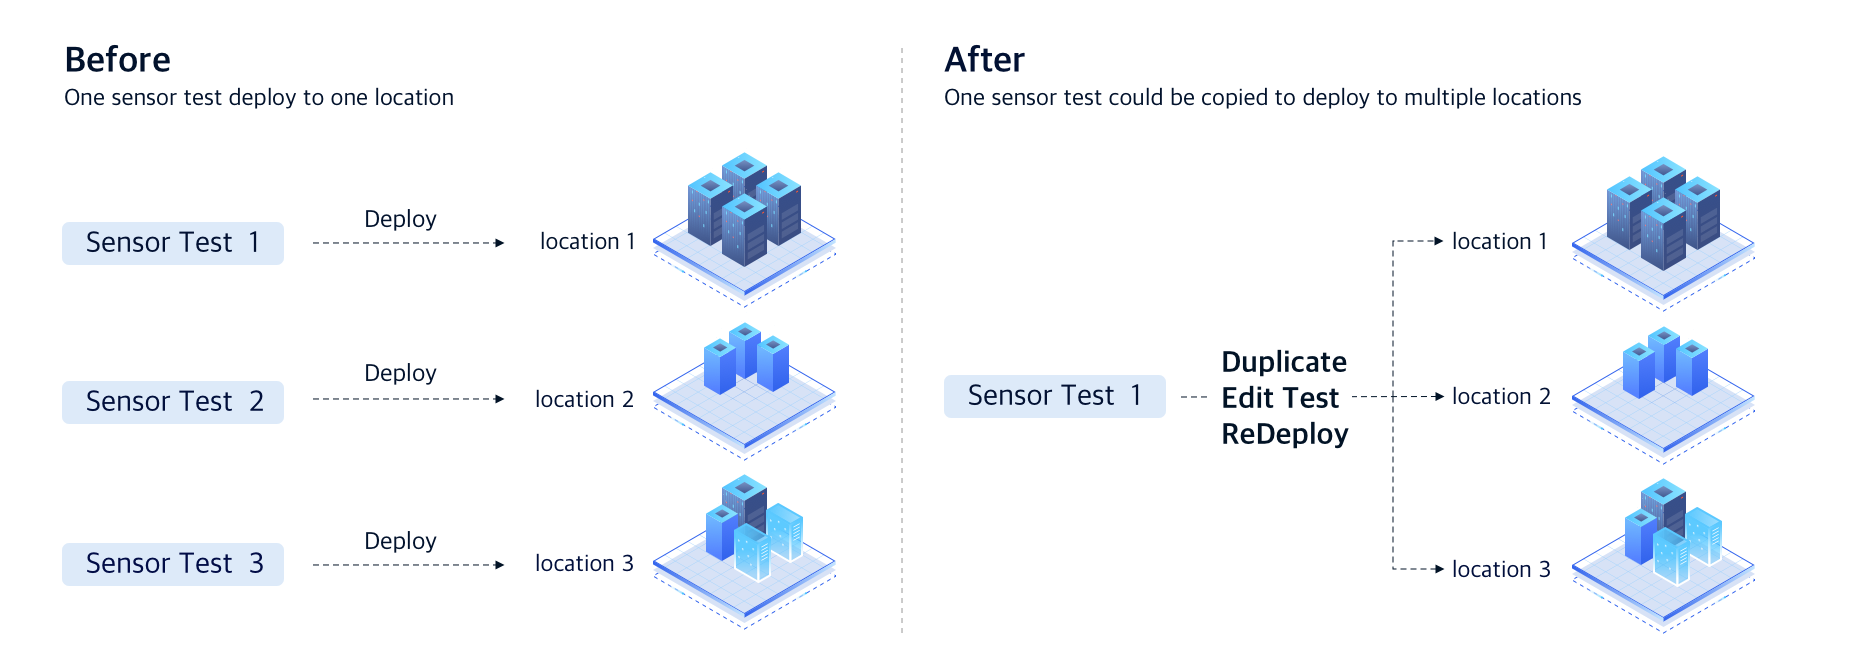
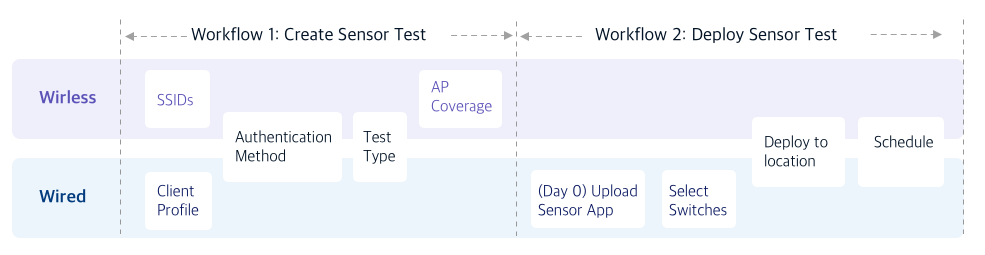
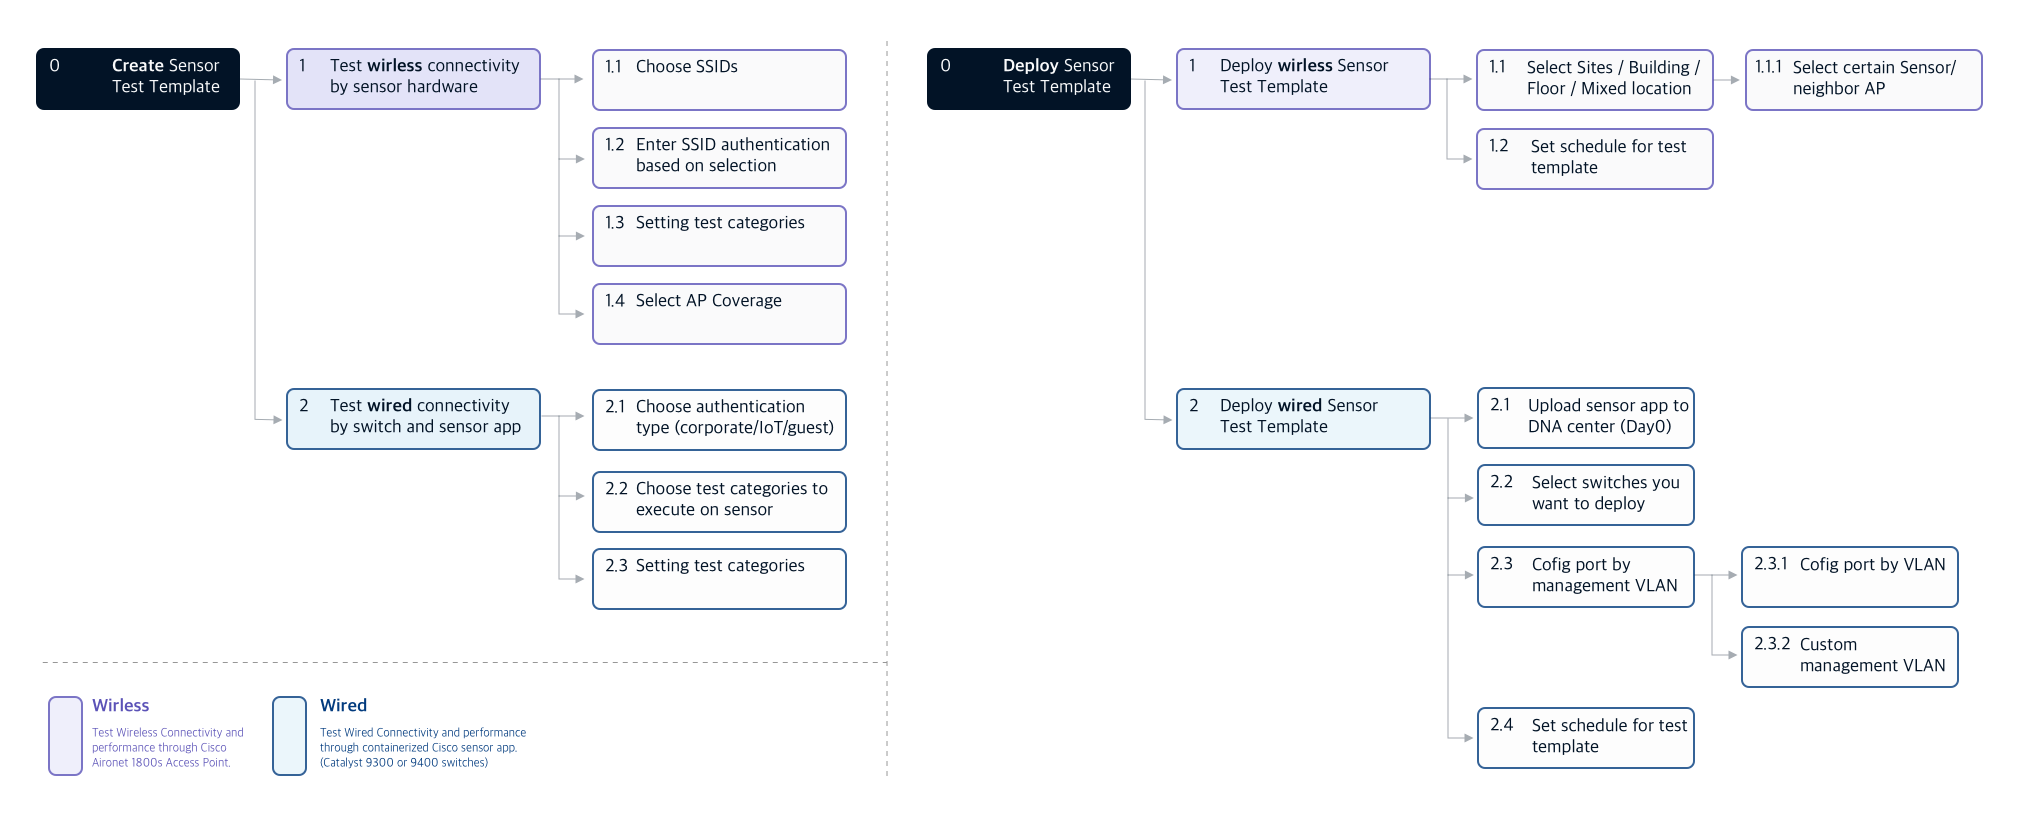
After – Solution
– Breakdown the setup sensor test workflow into two steps:
Step 1: create sensor test template
Step 2: deploy sensor test template into a different location
– In addition, giving users the ability to duplicate sensor tests or redeploy sensor tests to a different location.
Advantages
– Save user’s time for the task
– Make the structure more flexible
– Improve scalability
“Restructure the workflow to prevent duplicate of work “
3. Users have no confidence when they finish all setup
“Set clear feedback to enable people to act with confidence. “
4. Not intuitive and assistive
Before – Problems
After : Solution
I reorganized the input field into different steps to let users focus on the task rather than misleading by complex steps. Then I introduce a Job-to-be-done workflow to guide the user to achieve their task step by step.
“Using Jobs-to-be-done workflow to let users focusing on end goals for the task itself, clearly describing what users need to accomplish. It also created a seamless end-to-end experience.”
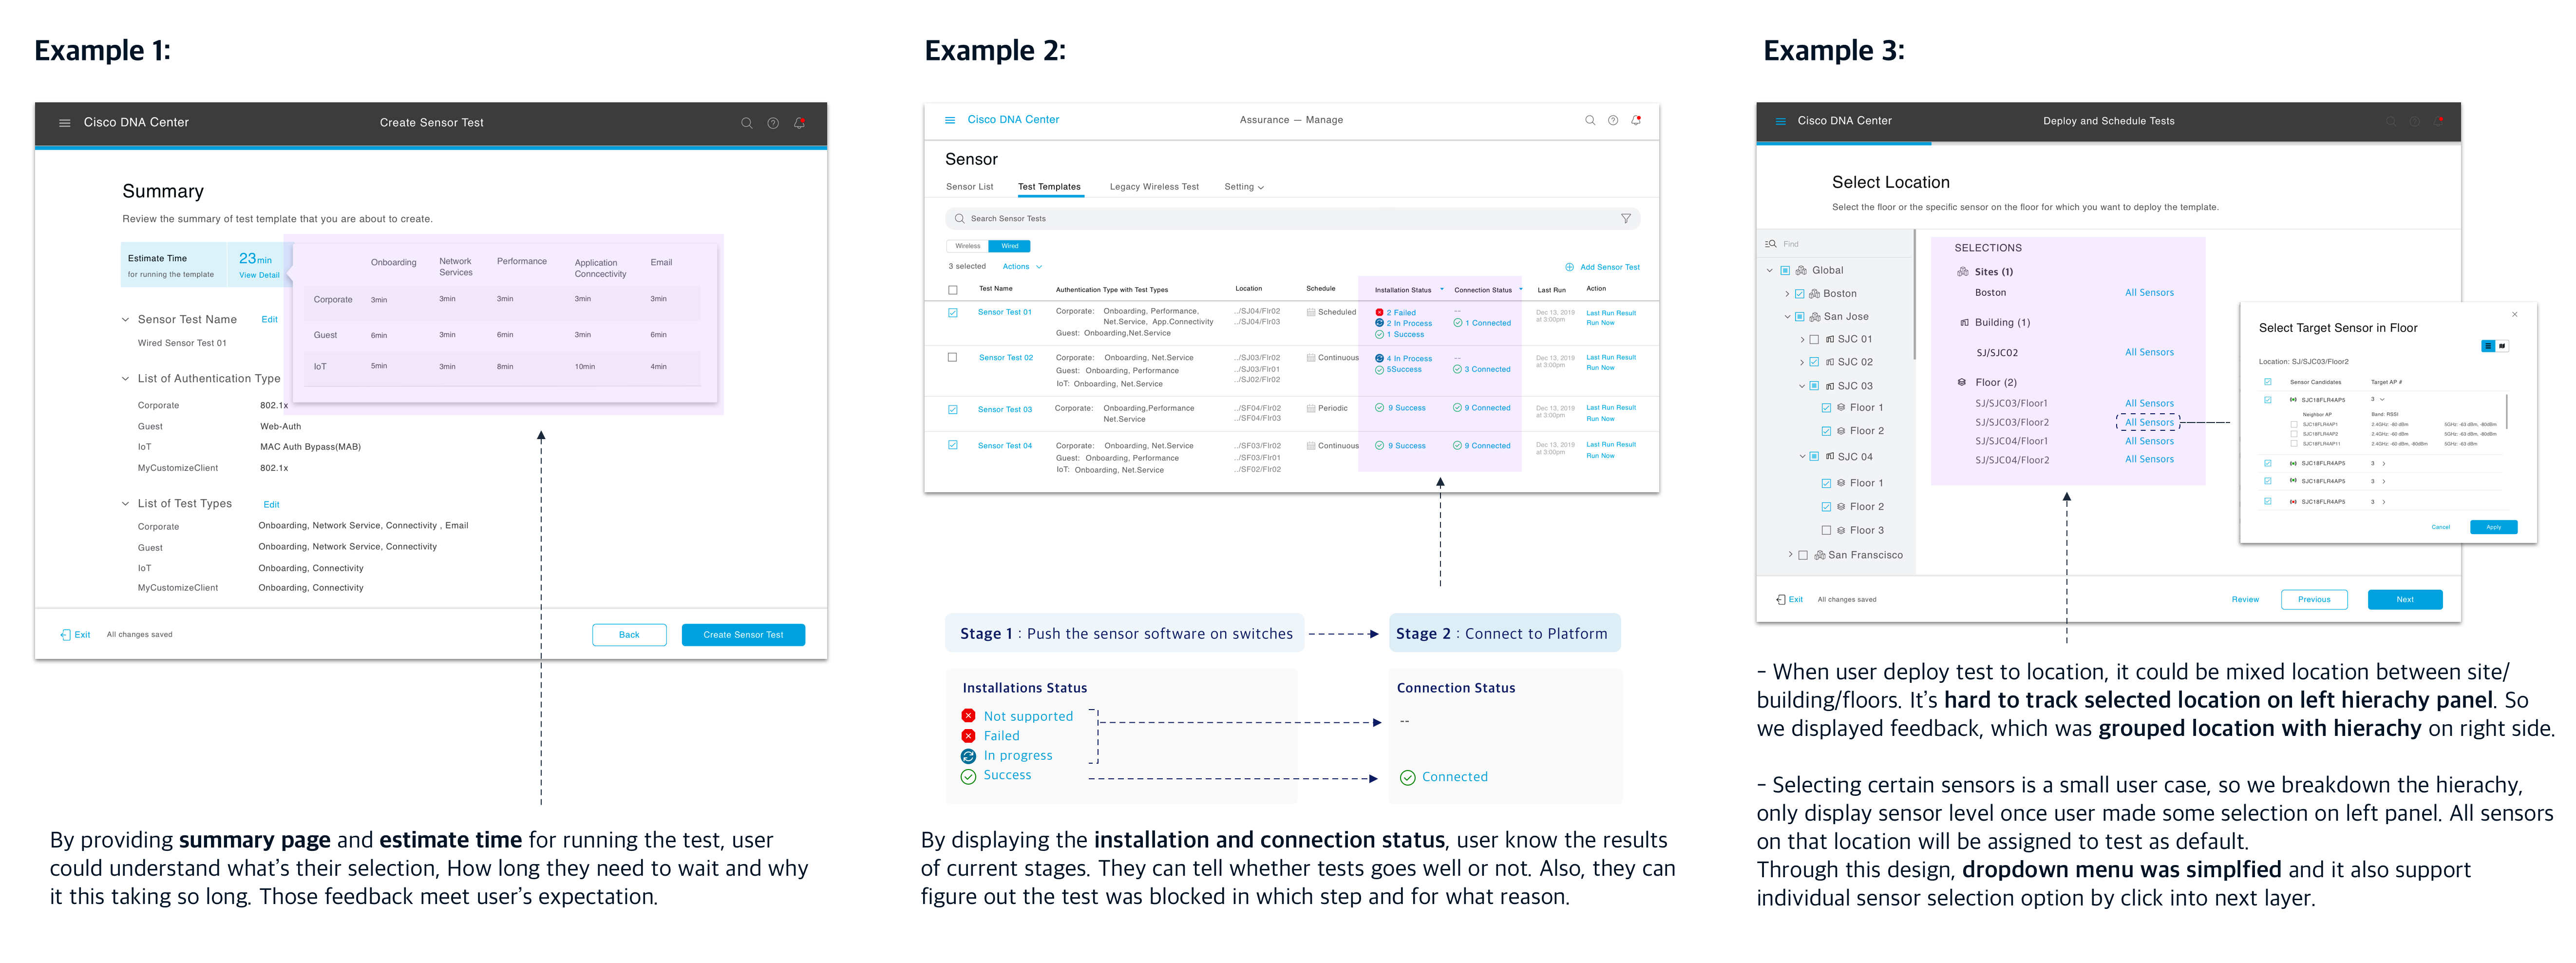
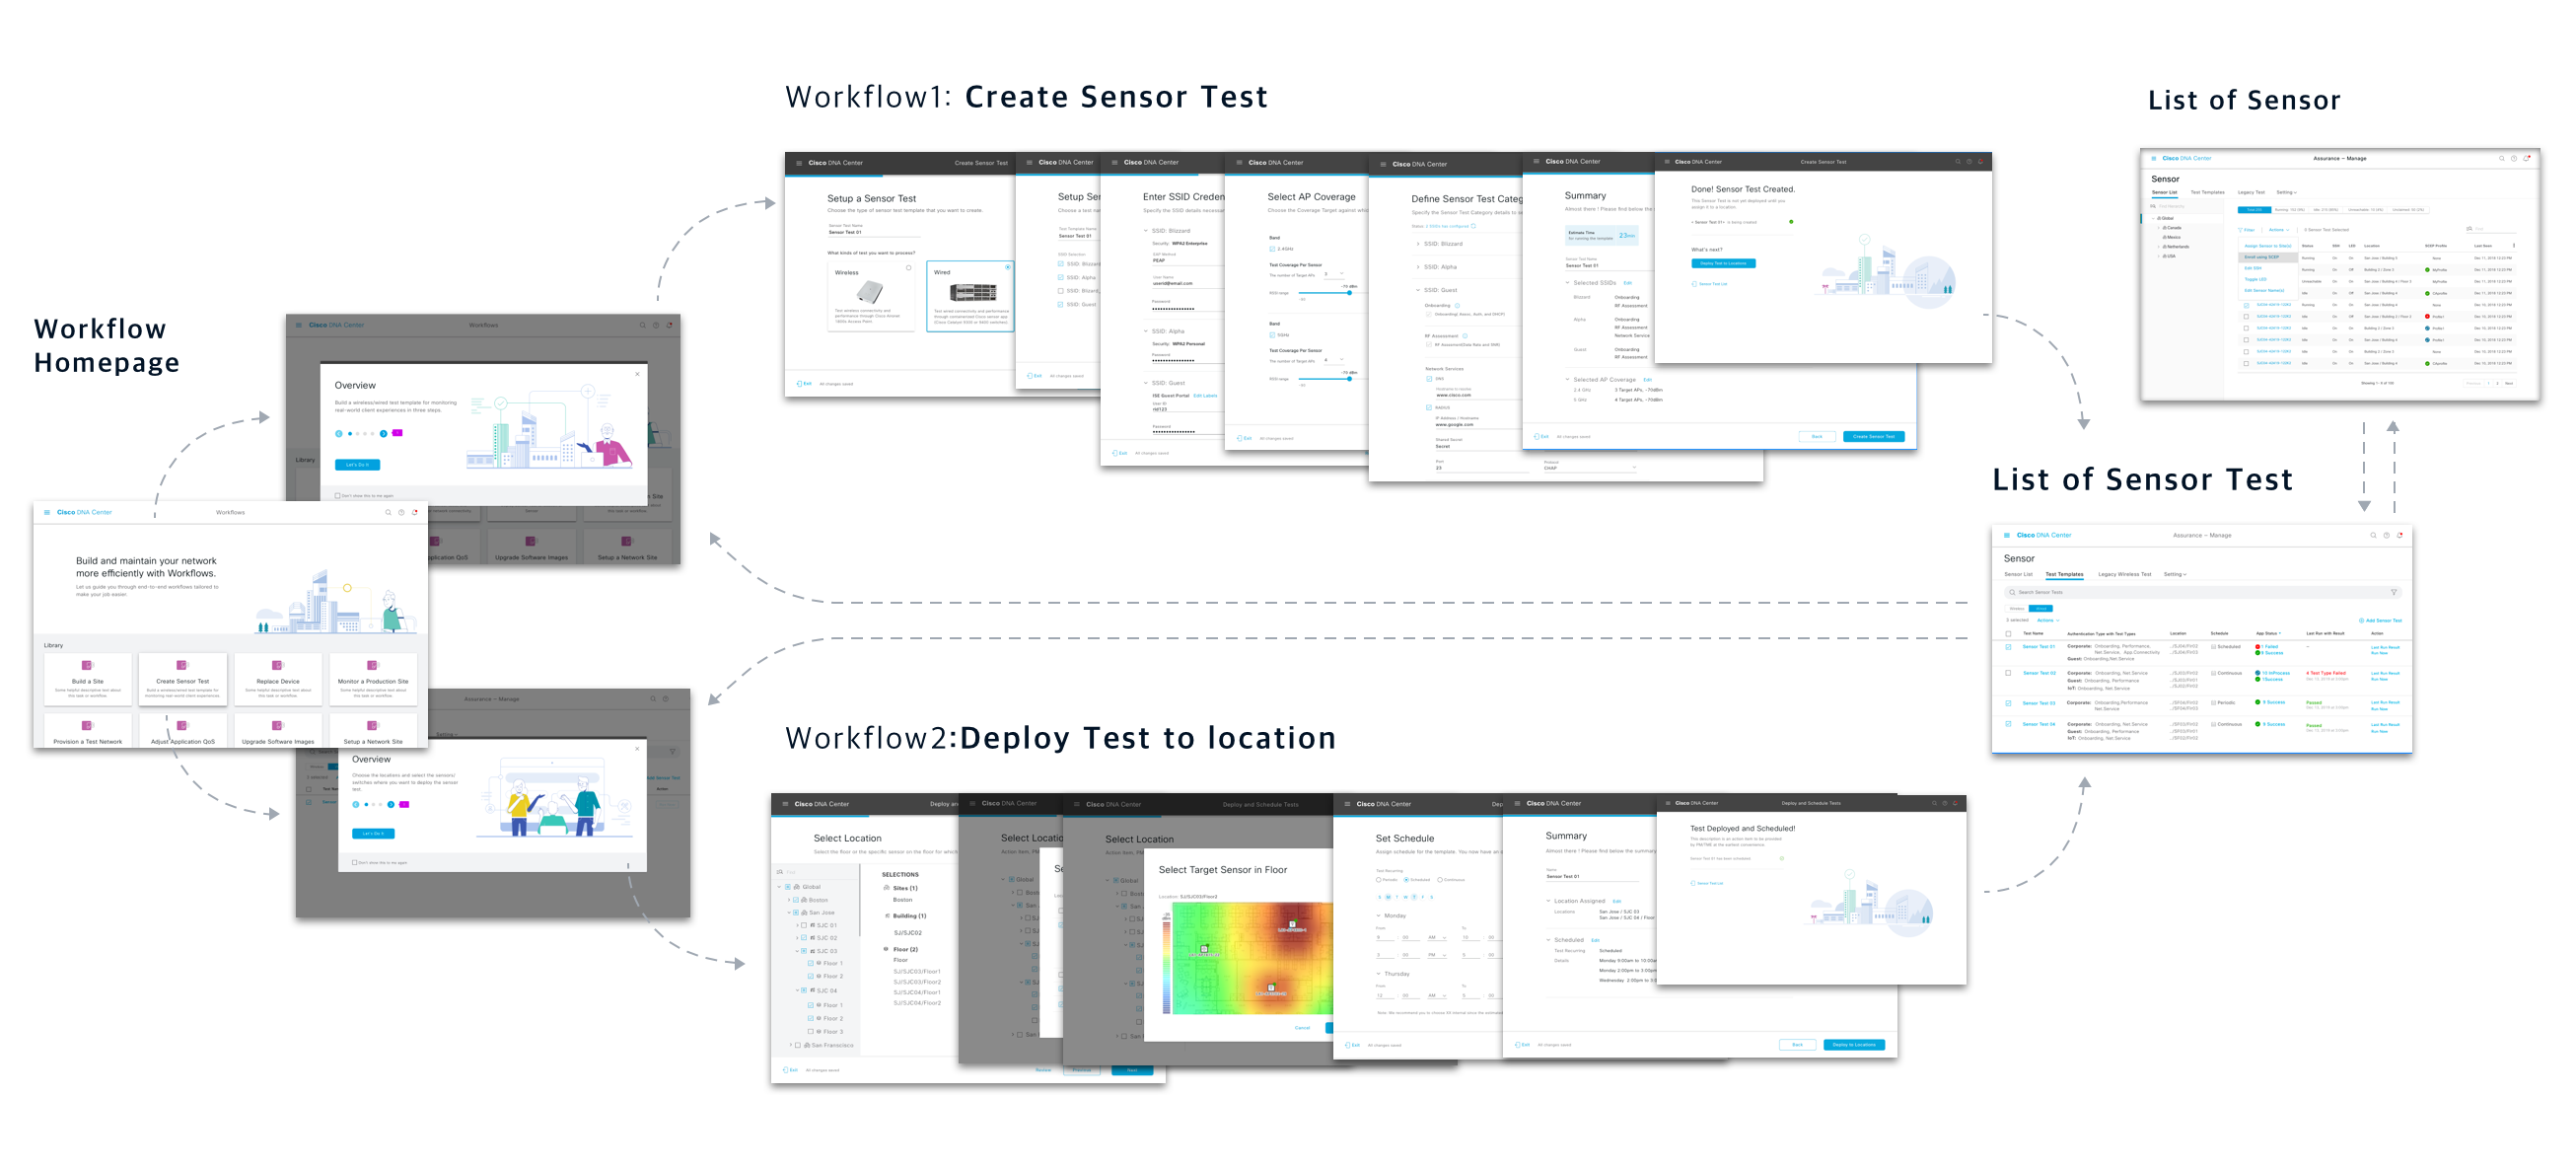
Design Deliverables
Task 1 : Test Creation & Deploy (Day 0)
Task Goal
Provide an end-to-end view regarding how to go from initially mounting physical sensors in the office to running the wireless test on the Cisco DNAC platform
Design Goal
With the ability to instantly create sensor tests by an assistive and intuitive workflow
Allow users to deploy these sensors across their entire network easily
Task Analysis
Deliverables
Task 2 : Monitor test result on Sensor analytical dashboard (Day N)
Task Goal
After sensor tests have begun executing, it brings us to day N cases that users can sit back and start monitoring sensor test results to access network health.
Design Goal
Make it human-interpretable with complex, large-scale, and multidimensional data.
Help users make the best sense of the data, analyze trends and drive decision making.
How I design data visualization product?
Because the data visualization dashboard is for discovery and insight purposes, the user flow is not a linear journey but a branching journey. (because many actions can be taken, such as filter/toggle/click on the chart.) So I translate the user story into a list of questions and see whether the design could solve all questions.
Deliverables
“ Troubleshooting from high-level summarized heat-map to granular details.“
View the Real-Time aggregated results of all provision sensors on the sensor dashboard
Discover target individual sensor results through the sensor 360 troubleshooting page
Mitigate issues by drill down into mid-level analytics to get instant clarity and root causes
Evaluate and Learning
Usability Testing
I worked with researchers to run usability testing to evaluate and gather feedback on new designs for sensor workflow and dashboard.
6 Participants
This time getting tremendous positive user feedback:
“There are actually a lot of good things, and I like how once I get there [drill down], I’d be able to click on these reasons and get real answers, instead of having to go to Google and forums to get answers.”
“In general, it is a big improvement… it’s a big step forward for monitoring and troubleshooting.”
“It’s a far better cry than what we have now, I can finish all test configuration with clear guidance”
Learning after launch
Know the domain knowledge, in-depth
Enterprise software is usually highly specialized and complex, which means designers face a steep learning curve. But when designers are equipped with that knowledge, they could consider the design in a big context, which is the key to creating a user-centered design. When considering the enterprise user will use our design for several hours every day to get work done, I feel satisfied to help them translate highly specialized and complex tasks into intuitive, accessible action.
Understand the end-users through various channels
It’s hard for enterprise-facing designers to build up empathy for end-users. So designers should learn customers from different resources. Such as talking with sales, customer service PM, and join the conference hold for customers. People from different positions give different perspectives.
Next Step – How to best utilize data from the sensor test result
The sensor dashboard is a dedicated page for test results. To create a holistic view for health assessment, we need to consider scattering sensor data on other health dashboards across the whole platform.